
Cloud Monitor
An intelligent monitoring platform that enables real-time health check of your business and cloud products
Overview
Cloud Monitor (CM) enables you to monitor and manage cloud products as well as configure and visualize your own custom monitoring metrics. Leveraging the three-dimensional, intelligent, real-time and personalized monitoring services, CM allows you to understand the health of your business and each cloud product in real time and with great accuracy.
Benefits
Automatic Activation
Second-Level Monitoring
Precise Alarming
Visualized Dashboard
One-Stop Monitoring
Efficient OPS
Features
- Comprehensive Metric-based Monitoring
- Custom Monitor
- Exception Alarms and Notifications
- Visual Chart Analysis
Scenarios
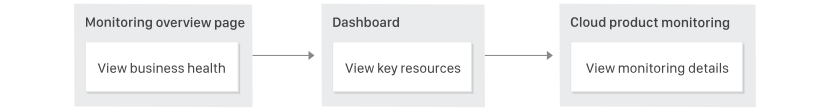
The goal of daily inspection is to manage cloud products and monitor their health on a daily basis. By directly logging in to the console, you can view the monitoring data of each metric for each cloud product and understand its running state with ease.
- In the Dashboard, you can view key resources, monitor custom cross-product and cross-instance key metrics in pinned display, and view monitoring data such as cross-instance aggregated data, real-time/historical data and comparison of similar metrics.
- By monitoring cloud products, you can view resource monitoring details and recognize even the smallest changes to the monitoring metrics. Moreover, you can check the cloud resource list and the corresponding monitoring and alarm details for each account, and immediately locate abnormal instances and troubleshoot problems based on the specific data and information of the exceptions.
- Daily Inspection
- Enterprise OPS
- Business Monitoring
The goal of daily inspection is to manage cloud products and monitor their health on a daily basis. By directly logging in to the console, you can view the monitoring data of each metric for each cloud product and understand its running state with ease.
- In the Dashboard, you can view key resources, monitor custom cross-product and cross-instance key metrics in pinned display, and view monitoring data such as cross-instance aggregated data, real-time/historical data and comparison of similar metrics.
- By monitoring cloud products, you can view resource monitoring details and recognize even the smallest changes to the monitoring metrics. Moreover, you can check the cloud resource list and the corresponding monitoring and alarm details for each account, and immediately locate abnormal instances and troubleshoot problems based on the specific data and information of the exceptions.